Top Crypto YTD › Momentum Investing Guide
Momentum Investing: How to Use YTD Rankings
An educational guide to reading this site’s data through a momentum lens.
What momentum is
Momentum is the tendency of assets that have performed well over recent months to keep outperforming for a while afterward, and of weak assets to keep lagging. It is one of the most studied effects in market research. In 1993, Narasimhan Jegadeesh and Sheridan Titman showed that portfolios of recent winning stocks beat portfolios of recent losers over the following months, and decades of follow-up work have found versions of the same pattern across stocks, bonds, commodities, and currencies.
A year-to-date (YTD) return is one momentum window: everything that has happened since January 1, compressed into a single number. It is a blunt measure, but a useful one, because it lines every asset up over the same period. Crypto trends can also be stronger and faster than stock trends, in both directions. A coin can build a large YTD lead in weeks, and it can give that lead back just as quickly.
How to read this site’s tables
Start with the leaderboard. The YTD ranking is a screening tool, not a buy list. It tells you where strength has concentrated so far this year. Momentum readers start at the top and work down, looking for names that keep showing up near the top week after week.
Check market breadth. The snapshot near the top of the homepage shows how many ranked coins are positive on the year and what the median return is. When most coins are up and the median is healthy, momentum has a tailwind. When only a handful of leaders are green and the median coin is deep in the red, the trend is narrow and more fragile.
Look at categories. The category rankings average returns by theme, such as AI tokens or liquid staking. A coin rising inside a strong category has company; a coin rising alone in a weak category is fighting its own sector. Category strength is a simple way to separate broad trends from one-off spikes.
Treat new launches separately. Coins that launched in 2026 have no January 1 baseline, so they sit in the “New in 2026” table on the homepage, ranked by return since tracking began. They are a separate and riskier momentum pool: shorter histories, thinner liquidity, and far bigger swings.
Compare head to head. The compare tool puts any two coins on one chart from any start date in 2026. It is the quickest way to check whether one leader is actually pulling away from another, or just keeping pace with it.
A worked example: reading today’s leader
To make the process concrete, here is the leaderboard read the momentum way, using the coin at number one as of November 02, 2026: Dolphin (POD). This walkthrough is an illustration of the process, not a recommendation to buy anything. The top of a crypto ranking is usually occupied by a small, volatile name, and the coin in this spot changes often, sometimes because it fell rather than because another rose.
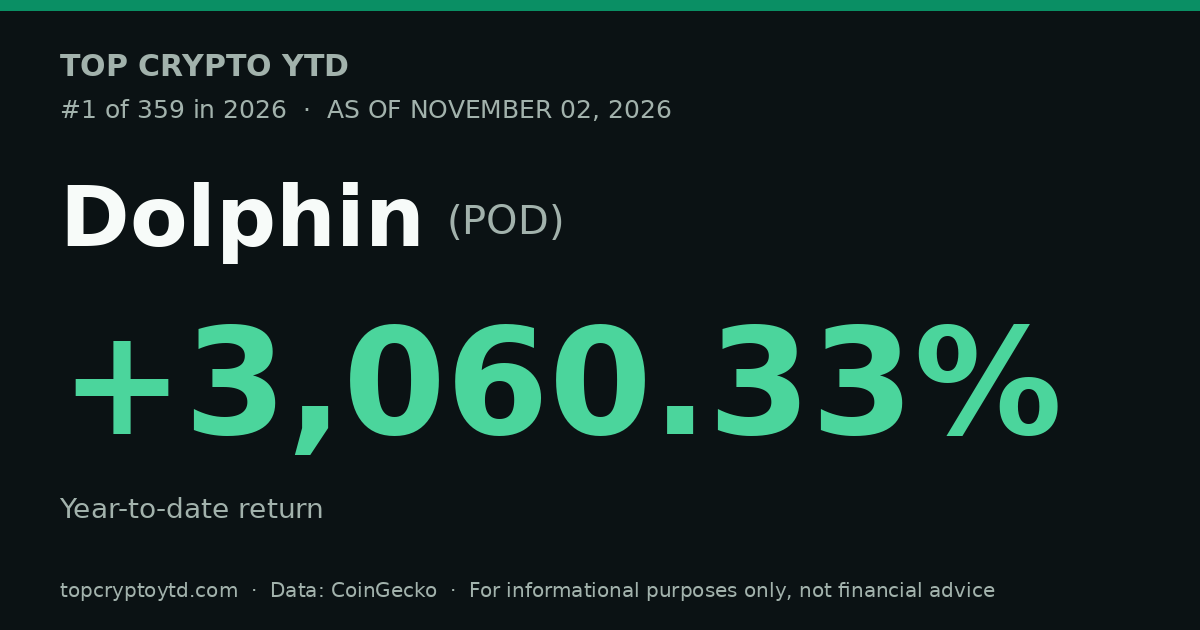
Step 1: the headline number. Dolphin stands at +3,060.33% year to date, from $0.0165 on January 1 to $0.520 now, the top of a ranking of 359 coins. For context, the median ranked coin stands at -17.24% and 30% of ranked coins are positive on the year. So the first question a momentum reader asks is already answered: this is not a coin merely floating up with a strong market. It is far out in front of one.
Step 2: does its category confirm? Dolphin belongs to the Artificial Intelligence category, which averages +138.88% across its 40 ranked coins on the categories page. The leader is ahead of its own category by 2,921.45 percentage points. That cuts both ways. The category is clearly not dragging it down, but most of this move is coin-specific rather than a theme lifting every member, so there is no category tailwind to catch the coin if its own story stalls.
Step 3: how extended is it? Interestingly, the coin is -29.99% over the last 30 days while still holding the year’s top rank. The year’s move is front-loaded and the recent trend disagrees with it. That is the signature of a tiring trend: the YTD table says leader, the shorter windows say caution. A momentum reader treats the YTD rank as history here, not as live momentum, and waits for the shorter windows to turn back up before giving the name any credit.
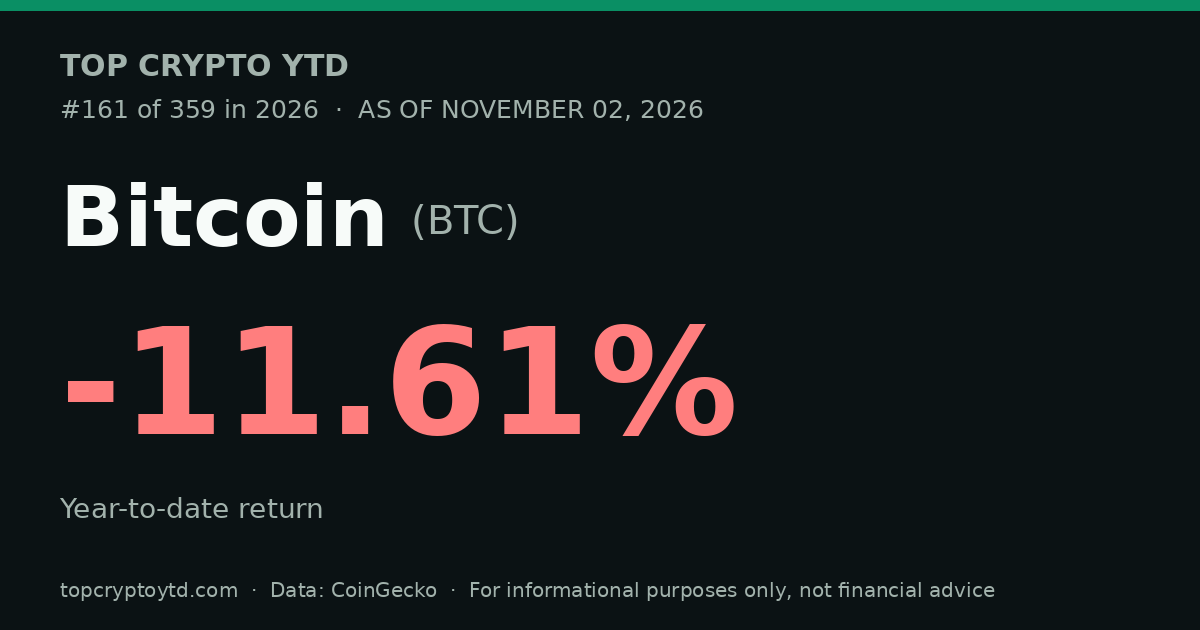
Step 4: what to check next, and what would invalidate it. A follower of this method would put the coin on the watchlist to track it against Bitcoin between reviews, run it through the compare tool against the next names in its category, and watch whether it holds the top ranks across several daily refreshes or arrived in a single spike. Liquidity deserves a hard look: the leaderboard is drawn from the top 500 coins by market capitalization and applies a minimum daily volume floor, which screens out the very thinnest names, but neither screen guarantees you could exit a large position near the quoted price. The setup invalidates if the coin slides down the table over consecutive reviews, if its category average rolls over, or if it gives back the last month of gains. When one of those happens, the method’s answer is rotation, not hope.
Momentum windows compared
YTD is only one way to slice time, and momentum readers use several windows at once. Crypto trades around the clock, with no overnight close and no weekends off, so a quarter’s worth of stock-market movement can happen in a few weeks. That is why crypto momentum leans on shorter windows than the three-to-twelve month windows used in the stock research: trends form faster, and they decay faster too. Each window below has a job, and each one lies to you in its own way.
| Window | What it captures | Signal vs noise | Where to see it here |
|---|---|---|---|
| One week | The immediate burst: a listing, a headline, a short squeeze unwinding. | Mostly noise on its own. Useful as an alert to go and look, not as a reason to act. | Top of the Week table on the homepage |
| One month | One full leg of a move, long enough to wash out single-day spikes. | The balanced window for crypto. Still jumpy in thin coins, but a month of strength is a real fact about demand. | Top of the Month table on the homepage and the monthly archive |
| Three months | A season of trend, roughly the length of most crypto narrative cycles. | Slower and steadier. It confirms genuine rotations, but it also keeps you in a topped coin longer before it turns. | Rebuilt from the top-25 lists in the monthly archive |
| Year to date | The year’s dominant trend, every coin measured from the same January 1 start line. | The most structural read, and the slowest to change. It lags for weeks after a regime turn. | The main leaderboard |
A workable blend is to screen on the YTD table, pay attention to the monthly window, and treat the weekly window as a news feed. When the windows disagree, say a coin sits at the top of the YTD table but is falling this month, the disagreement is itself the information: the long trend is tiring, and the burden of proof shifts to anyone who wants to keep following it.
A simple momentum routine
Momentum is a process, not a prediction. A basic routine built on this site looks like this:
- Build a watchlist. Pick a short list from the top of the leaderboard and save it on the watchlist page, which tracks your picks against Bitcoin between visits.
- Confirm the category. Prefer leaders whose category average is also strong. Strength with company behind it tends to persist longer than a lone spike.
- Check how far it has already run. A coin up 40% on the year is a different proposition from one up 4,000%. Extreme runs can continue, but the room for disappointment grows with the run.
- Review on a fixed cadence. Weekly or monthly reviews suit crypto’s speed. The point of a schedule is to make rotation a habit rather than a reaction to one bad day.
- Rotate out of fading names. When a holding slides down the table while others hold their rank, momentum readers replace it instead of averaging down into weakness.
Common mistakes
Most momentum losses in crypto do not come from picking the wrong coin. They come from a handful of process errors that repeat every cycle:
- Chasing a vertical run. By the time a coin tops the YTD table after a near-vertical month, much of its move is already behind it. Buying the most extended point on the chart means your first experience of the position is often the pullback. The table shows where momentum has been, not where it is about to start.
- Ignoring liquidity. A coin can show a huge paper gain on a thin order book: entering is easy, exiting at size is not, and the price on screen may be a price only the first seller gets. This site applies a minimum daily volume filter before a coin is ranked, but a floor is not depth. Check that real trading volume can absorb your position before treating a return as achievable.
- Comparing new listings with YTD coins. A coin launched in March showing a large gain since tracking began is not outperforming a YTD leader in the same sense. The baselines differ, the histories are shorter, and the risk is of a different kind. That is why this site keeps new launches in their own table, and why the two numbers should never be ranked together.
- Averaging down into a broken trend. Adding to a coin as it slides down the rankings is the opposite of the method. Momentum’s edge comes from cutting what fades. Averaging down converts a small, defined loss into an open-ended one, and it concentrates the portfolio in exactly the names the market is rejecting.
- Mistaking a category pump for coin strength. When a whole theme rips, in an AI-token week or a memecoin weekend, every member looks like a genius pick. Check the category average before crediting the coin: one that merely matches its category is riding the group, not leading it. Relative strength is measured against the group, not against zero.
- Having no exit rule. In a market where leaders can halve in days, deciding to sell “when it feels wrong” is not a rule, because it feels wrong at exactly the moment discipline is hardest. Decide the exit before entering: a rank the coin must hold, a category rollover, a fixed review at which laggards are replaced, and then follow it when it triggers, especially when it hurts.
The risks, plainly
Momentum reverses, and in crypto it reverses violently. The same speed that builds a YTD lead can erase it: market-wide sell-offs routinely take the most extended leaders down hardest, because late-cycle leaders are usually the most crowded trades. Small-cap coins can fall 50% or more in a few days, and thin order books mean the price on screen may not be a price you can actually get in size.
A YTD ranking also says nothing about fundamentals. It does not measure revenue, users, developer activity, token unlock schedules, or whether a project is sound. It records what the price has done, full stop. Readers who use momentum usually pair it with habits that limit the damage when it turns: sizing positions so one collapse cannot ruin the portfolio, deciding exit rules before entering, spreading exposure across several names instead of concentrating in one, and treating brand-new listings as the highest-risk corner of the market.
What a YTD rank does not tell you
A high YTD rank tells you a coin has gone up a lot since January 1. It does not tell you it will keep going up, that it is cheap or expensive, that its project is well run, or that you could sell a large position near the quoted price. Past performance is a record, not a promise.
Glossary
- Momentum
- The tendency of assets that have performed well over a recent window to keep outperforming assets that have performed poorly, for a period after the window ends.
- Relative strength
- An asset’s return measured against something else, typically a benchmark such as Bitcoin or the average of its own category, rather than on its own. It separates genuine leaders from coins merely floating up with the market.
- Breadth
- How widely a move is shared. On this site: the share of ranked coins that are positive and the median return. Strong leaders with weak breadth describe a narrow, fragile trend.
- Category rotation
- Money moving between crypto themes, such as AI tokens, liquid staking, or memecoins, as one group’s momentum fades and another group’s builds.
- Extension
- How far and how fast a price has run from its recent base. Highly extended moves have the most air beneath them and are the most prone to sharp pullbacks.
- Drawdown
- The fall from a peak to the following low. It is the loss you sit through if you hold from the top, and the number that decides whether a position size was survivable.
- Rebalance
- Periodically adjusting holdings back to the rules of the strategy: trimming or replacing names so the portfolio again holds what the method currently selects.
- Invalidation
- The evidence, decided in advance, that would prove a setup wrong: a lost rank, a category rolling over, a trend break. It exists so the exit decision is made calmly, before it is needed.
- Liquidity
- How much of an asset actually trades, and how easily a position can be bought or sold near the quoted price. Prices in illiquid coins are indications, not promises.
Frequently asked questions
Does momentum investing work in crypto?
The honest answer is that it has worked in stretches and failed badly in others. Momentum is one of the best documented effects in stock research, and crypto shows the same pattern of trends persisting for weeks or months at a time. But crypto trends reverse faster, spreads and slippage eat more of the edge, and the historical record is short. Treat momentum as a discipline for following strength with rules, not as a guarantee.
How often should you check a crypto momentum portfolio?
On a fixed schedule, weekly or monthly, and not whenever prices move. This site’s tables rebuild daily, but decisions do not have to. The watchlist tracks your picks against Bitcoin between visits, which makes a scheduled check quick: has anything faded out of the leading group, and has anything new earned a place in it?
What is the difference between momentum and FOMO?
Momentum is a set of rules decided in advance: which ranking you follow, what confirmation you require, and what evidence makes you exit. FOMO is a feeling: buying because a coin has already run hard and might leave without you. The two can point at the same coin on the same day. The difference is whether a plan, or the fear of missing out, is making the decision.
Can you use YTD returns for crypto momentum?
Yes, as the slow window. Every coin is measured from the same January 1 start line, so the YTD leaderboard is a clean comparison of the year’s dominant trends. Its weakness is lag: after a sharp market turn, the YTD table still describes the old regime for weeks. Pair it with the weekly and monthly tables, and with the monthly archive, to check whether the year’s leaders are still leading now.
What are the biggest risks of momentum trading in crypto?
Reversal speed, liquidity, and everything a ranking cannot see. Leaders can fall 50% or more in a few days. Thin coins can be hard to exit anywhere near the quoted price. And a YTD table records price only: it says nothing about token unlock schedules, project health, or exchange risk. The categories page helps you judge whether a move has company, but no momentum signal removes these risks.
How many coins should a momentum portfolio hold?
There is no single right number, but two forces bound it. Hold too few and one collapse dominates the whole result. Hold too many and you cannot review them on your chosen cadence, and the portfolio quietly becomes the market with extra fees. For someone following a table like this one, high single digits to a few dozen names is the workable range, sized so that no single coin can ruin the portfolio on its own.
This article is educational only and is not financial advice. Nothing on this page is a recommendation to buy or sell any asset. Past performance does not guarantee future results. Cryptocurrency is volatile, and you can lose some or all of what you put in. Consider your own situation and, if needed, a licensed financial adviser before investing.
Back to the live YTD leaderboard →
About · Contact · Privacy Policy · Affiliate Disclosure · Methodology
© 2026 MZX MEDIA LLC. All rights reserved.